Tag Archive for: mapping

This is a guest post from Jamie Lundine, who has been collaborating with Plan Kenya to support digital mapping and governance programming in Kwale and Mathare.

Throughout October and November 2011, Plan Kwale worked through Map Kibera Trust with Jamie Lundine and Primoz Kovacic, and 4 young people from Kibera and Mathare, to conduct digital mapping exercises to support ongoing youth-led development processes in Kwale county. One of the important lessons learned through the Trust’s work in Kibera and Mathare is that the stories behind the mapping work are important for understanding the processes that contribute to a situation as represented on a map. To tell these stories and to complement the data collection and mapping work done by the youth in Kwale, the Map Kibera Trust team worked with the Kwale youth to set up platforms to share this information nationally and internationally. Sharing the important work being done in Kwale will hopefully bring greater visibility to the issues which may in the longer term lead to greater impact.

Sharing stories of local governance

To support their work on social accountability, the Kwale Youth and Governance Consortium (KYGC) mapped over 100 publicly and privately funded community-based projects. The projects were supported by the Constituency Development Fund (CDF), Local Area Development Fund (LATF), NGOs and private donors. As one channel of sharing this information, the Consortium set up a blog called Nuru ya Kwale (Light of Kwale). According to KYGC the blog “features and addresses issues concerning promotion of demystified participatory community involvement in the governance processes towards sustainable development. We therefore expect interactivity on issues accruing around social accountability.” This involves sharing evidence about various projects and stories from the community.

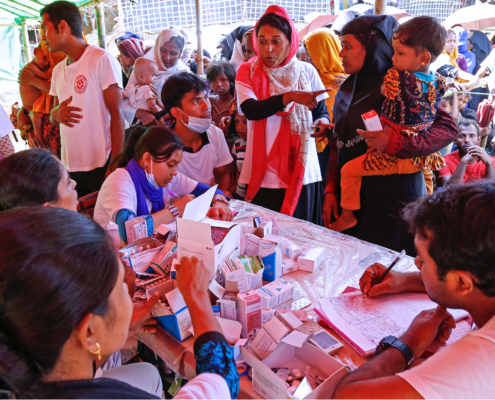
One example is the documentation of the Jorori Water project in Kwale; through the mapping work, the Governance team collected details of the constituency development fund (CDF) project. The funding allocated to upgrade the water supply for the community was 6,182,960 ksh (approximately 73,000.00 USD). From their research the KYGC identified that the Kenya Open Data site reported that the full funding amount has been spent.

A field visit to the site however revealed that project was incomplete and the community is still without a stable water supply, despite the fact that the funding has been “spent.”

Jorori Water Project KwaleJorori Water Project, built using approximately 6.2 million shillings (73, 000.00 USD)

Read more about the questions the team raised in terms of the governance of CDF projects, including the detailed the project implementation process and some reflections on why the project stalled. This is information on community experiences (tacit information) that is well-known in a localized context but has not been documented and shared widely. New media tools, a blog in this case, provide free (if you have access to a computer and the internet) platforms for sharing this information with national and international audiences.

Addressing violence against children and child protection

Another blog was set up by the Kwale Young Journalists. The Young Journalists, registered in 2009, have been working with Plan Kwale on various projects, including Violence against Children campaigns. The group has been working to set up a community radio station in Kwale to report on children’s issues. Thus far, their application for a community radio frequency has encountered several challenges. New media provides an interim solution and will allow the team to share their stories and network with partners on a national and internal stage.

The Kwale Young Journalists worked with Jeff Mohammed, a young award-winning filmmaker from Mathare Valley. The YETAM project not only equips young people with skills, but through peer-learning establishes connections between young people working on community issues throughout Kenya. The programme also provides young people with life skills through experiential learning – Jeff reflects on his experience in Kwale and says:

KYJ filming the enemy withinJeff and the Kwale Young Journalists shooting a scene from “The Enemy Within”

“My knowledge didn’t come from books and lecturers it came from interest, determination and persistence to know about filmmaking and this is what I was seeing in these Kwale youths. They numbered 12 and they were me. They are all in their twenties and all looking very energetic, they had the same spirit as mine and it was like looking at a mirror. I had to do the best I could to make sure that they grasp whatever I taught.”

Jeff worked with the Young Journalists on a short film called “the Enemy Within.” The film, shot with flip-cameras, tells the story of 12-year-old girl who is sold into indentured labour by her parents to earn money for her family. During the time she spends working, the young girl “falls prey of her employer (Mr.Mtie) who impregnates her when she is only 12 years old.” Jeff reflects that “early pregnancies are a norm in the rural Kwale area and what the young filmmakers wanted to do is to raise awareness to the people that its morally unacceptable to impregnate a very young girl, in Enemy Within the case didn’t go as far because the village chairman was bribed into silence and didn’t report the matter to higher authorities.” This is a common scenario in Kwale, and the young journalists plan to use the film in public screenings and debates as part of their advocacy work in the coming months.

Jeff and the Kwale Young Journalists shot the film in four days – they travelled to Penzamwenye, Kikoneni and also to Shimba Hills national park to shoot 7 scenes for the movie. Read more about Jeff’s reflections on working with the Kwale Young Journalists on his blog.

Sharing ecotourism resources

The Dzilaz ecotourism team – a group that encourages eco-cultural tourism in Samburu region of Kwale county — also integrated social media into their work. During the last week (November 8th-12th) the group set up a blog to market the community resources, services and products. They also plan to document eco-culture sites and the impact that eco-tourism can have on the community. As of November 10th, 2011 the Dzilaz team had already directed potential clients to their website and thus secured a booking through the information they had posted.

The importance of telling the stories behind the maps

One important component to mapping work is to tell the stories behind the map. The three groups in Kwale are working to build platforms to amplify their grassroots level work in order to share stories and lessons learned. The information documented on the various platforms will develop over time and contribute to a greater understanding of the processes at a local level where youth as young leaders can intervene to begin to change the dynamics of community development.

Close up of a drop of water splashingThere’s been considerable debate lately about possible uses of information and communications technology for watershed management. Access to monitoring programs assists governments adequately manage and distribute water. Watershed management is critical for regional ecological health, clean water ability, disaster relief, and agriculture.

5 Noteworthy ICT Watershed Management Projects

  •  eGov features India’s Mahatma Gandhi National Rural Employment Guarantee Scheme (MGNREGS) that uses GIS mapping and GPS enabled mobile applications for planning and monitoring rainwater harvested agricultural land. The watershed is analyzed  through interactive online mapping available in local languages, engaging parties at the village, regional, and state levels. Through this process scarce water is conserved by a supervised drainage line, promoting the cultivation of arable land and responsible seasonal planning. An overview of this project is available HERE.
  • A similar project, MeKongInfo, is available to citizens along the Mekong River Basin  in Cambodia, Thailand, Laos, and Vietnam. The site houses a database and online discussion that is sponsored by the Mekong River Commission (MRC). It contains  many aspects including flood mitigation, fishery management and other issues of overall planning.
  • AgWater Solutions is collaborating with the International Water Management Institute (IWMI) and others in Ethiopia through workshops to address small reservoirs and groundwater systems investment.
  • Rio+20’s ICT as an Enabler for Smart Water Management report  includes case-studies on ICTs for smart water initiatives. Also worthy of noting as a resource is the United Nations’ Virtual Learning Centre distance-learning course on Integrated Water and Environmental Management for creating regional resource databanks to enhance sustainable water management practices. The course is available through Regional Centres of Excellence in Africa, Asia, and the South Pacific.


woman with baby in somalia Photo Credit: UN

Photo Credit: UN

Amartya Sen famously once observed that famines rarely occur in democratic or even relatively free societies, rather from inequalities built into the societal mechanisms of food distribution. The current famine declared by the U.N. in Southern Somalia, exemplifies his case and point.

New mobile technologies and ICTs in aid projects, however, can be used to streamline the coordination between aid organizations on the ground, populations desperate for aid delivery, and those funding the projects abroad—and make them more sustainable.

As Charles Kenny points out, the modern expansion of international markets and improved international assistance have drastically reduced the probability of famines solely resulting from weak governance.

Alternatively, the government—or those in charge—must deliberately choose to deprive their people of food and, “…actively exercise the power to take food from producers who need it or deny food assistance to victims,” Kenny writes in Foreign Policy.

The political atmosphere within the two regions of Southern Somalia is a huge factor towards the most recent accumulation of mass malnutrition and starvation.

Lacking a sovereign state, citizens must rely on the governance provided by the decentralized al Shabab—who blames food aid for creating dependency—which does little to ensure access to food, preventing malnutrition, or improving livelihoods of the population.

In February 2010, the militant group ousted the World Food Program (WFP), followed by their expulsion of three other aid agencies, where they were accused of spreading Christian propaganda.

Photo Credit: BBC

Photo Credit: BBC

Al Shabab removed the food aid earlier this month, declaring that agencies without hidden agendas were free to operate in their areas. Later, they announced that expelled agencies, namely WFP, remained banned.

Despite these efforts of dissuasion, WFP airlifted 10 tons of food to Southern Somalia last Wednesday. Mobile technologies can used to track this aid to ensure that it is kept out of the hands of al-Shabaab and into the hands of the malnourished.

Ensuring that they honor their word and delivering aid are two battles to overcome, encouraging harmony for further aid distribution is another.

If al-Shabab upholds their promise to allow food aid in the upcoming months, there should be coordination to make these programs and projects happen efficiently and sustainably—between Southern Somalia’s civil society, the government, and aid agencies who hold the resources.

Aid agencies should capitalize on ICTs to enhance the collaborative effort between organizations and individuals with eyes on the ground, and those pulling the funding strings up in Washington.

Edward Carr who works in famine response for USAID on the ground in the Horn of Africa, says,

…we are going to have to use our considerable science and technology capacity to really explore the potential of mobile communications as a source of rapidly-updated, geolocatable information about conditions on the ground to which people are responding with their livelihoods strategies

Although this new way of collecting information for benefit incidence analysis is useful for tracking who each dollar benefits, it is only resourceful in the long-term if put into a local social context.

Who is the most impacted, but most importantly, why- is what truly matters in the long run.


Hilary Clinton at the Open government partnership

Photo Credit: U.S. State Department

Nation states, civil society groups, and private sector representatives from around the world, convened earlier this month at the Open Data Partnership (OGP) in Washington D.C. to discuss the best practices of open data e-government tools.

On July 12, more than 60 governments and 60 civil society groups joined the United States and Brazilian governments to pledge support on initiatives encouraging citizen’s participation, putting voters at the heart of solving their own society’s complex social issues.

The OGP is a new, multilateral initiative aiming to secure and define commitments from governments worldwide to promote transparency, empower citizens, fight corruption, and harness new technologies to strengthen governance.

The formal launch of the OGP is set for this September, when participating governments will embrace an Open Government Declaration, and announce their country action plans to promote OGP principles.

Last September at the United Nations General Assembly, President Obama challenged countries to embrace open government saying:

When we gather back here next year, we should bring specific commitments to promote transparency; to fight corruption; to energize civic engagement; and to leverage new technologies so that we strengthen the foundation of freedom in our own countries, while living up to ideals that can light the world

The new technologies that President Obama refers to are starting to be used throughout the globe—including Kenya’s Open Data Initiative and Huduma. These tools enable citizens to use their mobile phones or web browsers to bring public service problems that they encounter everyday to public discourse.

Viviane Reding, Vice President of the European Commission once stated that, “participation is the real goal of e-government,” and city administrators from Washington to Bangalore actively are recognizing that citizen reporting tools can help highlight some of the worst social and public service issues within their cities.

This acknowledgment infers that top down designation of funding will no longer be the course that that future governments around the world will take.

Notably, countries such as Mexico, Brazil, Indonesia, India, Mexico, Norway, Philippines, South Africa, United Kingdom, and the United States and several large civil society groups—took part in the OGP pledge.

This is a huge step towards civil society empowerment, enabling the tax paying citizens to take collaboratively take charge of the changes they want to see in their communities—truly giving power back to the people.


Linda Raftree speaking at GBI Brown Bag Lunch

Photo Credit: Laurie Moy

Last Friday, GBI sponsored a Brown Bag lunch at USAID featuring Linda Raftree (@meowtree), Senior ICT4D Advisor at Plan International USA, to discuss her experiences on her digital participatory mapping project in Cameroon, lending insight on how the team got it off the ground.

Utilizing the mapping platform Open Street Map and crowd-sourcing tool Ushahidi, Raftree and Plan International’s Youth Empowerment through Technology, Arts and Media (YETAM) project, aims to reduce violence against children and increase youth participatory governance.

During her discussion last week, she referenced how digital community maps have replaced the need for paper-based diagrams since they can be shared or updated, to put rural areas like Ndop, Pitoa and Okola, “on the map”.

The more pragmatic purpose of being, “on the map,” Raftree alluded, is to see where infrastructure and services are being provided by local councils. Maps illustrate the uneven distribution of funding and services, and show what areas need more inclusion, holding governments to their development responsibilities.

Linda Raftree speaks at GBI Brown Bag Lunch

Photo credit: Laurie Moy

To ensure local participation and encourage youth empowerment for the three principal components of her project—maps, video, and art—Raftree advised some of these following elements:

  • Ask community leaders, and youth the information they want to put on the map. Raftree found that the youth wanted to know where all of the chieftain of the surrounding villages lived since traditionally greeting them first when arriving to a village is a respectful custom. What an international organization, or its stakeholders, want does necessarily line up with what the community needs or finds relevant.
  • Hire local ICT experts.  She had found a local GIS expert named Ernest on Twitter and through Limbe Labs (now Activspaces). Without him, Raftree admitted, the project would not have been nearly as successful, or predicted to be as sustainable. Local ICT experts know the language, law of the land, and projects can be easily supported by them teaching others in the community how to maintain the mapping systems long after outside organizations leave.
  • Engage decision makers.  There is usually a hierarchy within communities, so involving big players is imperative for successful deployment. Both to evade bribery—the team had youth carry around a letter signed by the local mayor stating it was okay for them to collect information—and to make leaders accountable for gaps in funding and services.
  • Record it. The Cameroonian youth went around with video camcorders, and recorded interviews they had with leaders of certain institutions, and members of the community. For example, they went around to schools and interviewed the headmasters about what resources they had at the school, and with women on why they did not register their newborn children. The benefit of this is two-fold. They raised the headmaster’s awareness on for the importance of keeping data on key indicators of the school (numbers of students, benches, attendance, teachers), Raftree stated, while making politicians accountable to the imbalanced circulation of disbursement.
  • Mix technology with non-technology. The art portion of the project, where the youth draw pictures of social issues existing within the community—such as alcoholism, drug use, and domestic violence—raised problems that were uncomfortable to record on film or talk about. Despite a lack of sound or words, art is still a powerful visual empowering the community to engage in a dialogue about taboo subjects.

The end result of all these steps in the 3 districts in Cameroon? Leaders acknowledged giving funds to central areas, and began to allow youth to take part budget meetings. The youth were given a voice in a place where they were never even part of the discussion.

Linda Raftree speaking to attendees after the event

Photo credit: Laurie Moy

Although Raftree covered a lot of problem areas that could have arisen in a community mapping project, she recognized that issues such as connectivity and ICT training, are still barriers to entry that need to be addressed for a project’s overall sustainability.

How about the next steps for the Plan International’s YETAM project in Cameroon?

Having youth continue to follow-up with database collection, making community councils accountable for their findings, and integrating information into Plan’s overall decision making.


For more information regarding upcoming events, subscribe to our newsletter, The Spectrum.

Mapping and Geographic Information System (GIS) have long been used in Rwanda for sectors such as agriculture and economic growth. The need for these innovative tools and skills, however, are just now being recognized in other fields, including health. As a monitoring and evaluation expert, I have seen how useful geography and maps can be to monitor and improve programs, and I was interested to learn more about how they were being used and enhanced in the field.

For four days, I joined 18 public health professionals at a GIS training in Kigali, Rwanda, organized by MEASURE Evaluation and Monitoring and Evaluation Management Systems (MEMS) and supported by USAID in collaboration with National AIDS Control Commission (CNLS ). The participants represented many local Rwandan organizations such as MEMS, the Ministry of Health, the Center for Treatment and Research on AIDS, Malaria, Tuberculosis and Other Epidemics (TRAC Plus), and National University of Rwanda’s School of Public Health.

Andrew Inglis and training participants use qGIS and local data to produce maps that can be used for monitoring HIV programs.

GIS is a unique tool that allows people to interact with their data. Rather than comparing data in charts or graphs, mapping data through geography allows data users to identify essential trends and associations that may not be apparent in other formats. By building local capacity in GIS, we are expanding “evidence-based decision making” for high quality and strategic health programs.

There was a lot of enthusiasm during the training about GIS. The training provided an excellent forum for the participants to talk about innovative ways they are already using the GIS tool. Participants discussed plans to create  new programs that would allow for better ownership and monitoring, to improve supply chain management, and to integrate services, all things that will support and enhance the projects that USAID and its partners are implementing.

MEASURE Evaluation trainers, Andrew Inglis and Clara Burgert, introduced the concept of GIS maps and their ability to link to a database that is capable of capturing, storing, querying, analyzing, displaying and outputting data. In addition to teaching concepts such as how to interpret maps and how to effectively use spatial data, the training provided participants an excellent opportunity to gain practical experience.

Prior to the training, data was collected from each of the representing organizations so they could to make a map during the training and present to the group. All the participants also left with qGIS, an excellent free mapping tool, giving them something to work with as they began to hone their new skills and build their organizational capacity.

Andrew Inglis is a firm believer building capacity through the use of geographic and spatial data for program planning, implementation, monitoring, evaluation and advocacy. He explained, “The goal of capacity building is to turn potential into reality.  During the January 2011 stakeholders meeting the potential value of GIS towards evaluation of HIV prevention programs were recognized, however, the lack of capacity within the national institutions is a major barrier.  The aim of the capacity building is to start to realize this potential and reduce the capacity barrier to the use of GIS within national institutions.”

After the training, MEASURE Evaluation wrapped up the week with an Open Forum, hosted by the CNLS, inviting participants and other stakeholders to discuss how best to put these newly acquired skills to use. The goal was to create linkages between the HIV/AIDS and health sectors (and other related sectors) and to promote the sharing and use of data linked to geography in Rwanda.  It was energizing to be there, discussing with Rwandan colleagues how they can use GIS and mapping tools to connect better with each other, improve the way they plan, implement and monitor health services, and ultimately improve the health outcomes in their country.

As Solomon Kununka, Management Information Systems Specialist from MEMS, put it, “This has initiated me into the GIS community.  Now I want even more training.  But, I have the basics.  I can make maps for my supervisor and me, to be used for decision making.”


map of roads either complete or incomplete

Photo Credit: Rising Voices

In India, fishermen living in the city of Olcott, Chennai have relied on the beach for hundreds of years to earn livelihoods. After the British acquired this three-mile strip of land, members of this fishing community were deemed trespassers in their own homes.

Now, participatory mapping drawn up by Olcott citizens helps to create a visualization of the relationship between the fishermen and the coastline to make the government more responsible and accountable.

This is the objective of Transparent Chennai, a hands-on platform created by The Center for Development Finance, working under a Rising Voices Microgrant.

Aggregating, collecting, and displaying data for public interest use, on Usur and Olcott fishing communities in South Chennai, provides a visual to the gaps where legislation needs to be created. This ensures that fisherman have access to the water and can claim rights to their land.

The statement on the website clarifies their end goal:

Our goal is to enable residents, especially the poor, to have a greater voice in planning and city governance

Residents of Usur and Olcott engage in participatory workshops where they contribute to the map, mark the boundaries of their village, and land use patterns. They can show varying livelihoods within the community, and how space outside of their homes is used, particularly along the water.

The maps identify local resources, points of historical and ritual importance, and gaps in local infrastructure and government services. By providing easy-to-understand information, the maps can better highlight citizen needs, shed light on government performance, and improve their lives in the city, one issue at a time.

Transparent Chennai believes that lack of data has sometimes allowed for the government to evade its responsibilities and to provide basic entitlements to all city residents.

They collaborate with citizen to integrate accurate, first hand information. “We work closely with individuals and citizens’ groups to create data that can help them counter inaccurate or incomplete government data, and make better claims on the government for their rights and entitlements,”

Creating the maps is not limited to just the perspective of adult citizens, though.

Recently, eighth grade students at Olcott Memorial School in Besant Nagar participated in a four-week mapping workshop run by Transparent Chennai. Using Google Earth and Google Maps, along with paper maps, they marked their own important landmarks of the city.


Students use paper to figure out how their symbols should look. Red writing with things like bathroom posted on it [Photo Credit: Siddharth Hande

Students use paper to figure out how their symbols should look Photo Credit: Siddharth Hande

Anjney Midhall, who facilitated the mapping workshop describes the scene at the school: “…around me, children of the eighth grade at the Olcott Memorial School in Besant Nagar are busy mapping out their school’s campus in groups, developing their own unique symbols and keys, color schemes and layouts…By the end of the session, maps emerge, each diagram telling a story of its own.”

Through locally generated maps, Transparent Chennai aims to do their part in rectifying a lack of data and the lack of government accountability to meet the basic needs of its citizens. ‘Participatory mapping’, is one of the best ways to do this.


I recently finished a chapter for a book to be published by the National Defense University about the persistent problem of information asymmetry in disasters, the condition by which information is disaggregated in such a way that it compounds the already horrendous logistics struggle of humanitarian organizations to provide life-saving aid to victims. Food drops are missed by the general population, the wrong supplies get to the wrong hospital, and water sits on a tarmac rather than getting into the hands of people who are desperate for it. Information asymmetry has two dimensions: the inability to get any data from a lack of access to that information or the inability to take aggregated data and make sense of it all. Often in disasters the first dimension is attributed to a lack of connectivity – whether because of geography or lack of infrastructure (cell phone towers tend to collapse in earthquakes, floods etc.). Six years ago, NetHope and a variety of private sector partners tackled the condition of connectivity in disasters with the creation of the Network Relief Kit (NRK) . The NRK, which fits in a backpack, has a BGAN satellite receiver about the size of a medium-sized textbook. It provides a broadband connection to the Internet, runs off a car battery (or small solar panel) and works almost anywhere on the planet. It has a built-in wireless router for WiFi to support up to ten laptops or Internet phones. So it creates a fast, temporary but crucial voice and data communications hub for a small group of fieldworkers when they need it most immediately – in emergencies.
While the NRK does amazing job of connecting, there are some disasters where the lack of connectivity is compounded in places (like Myanmar after Cyclone Nargis or today’s current conflict in Libya) where autocratic regimes have “shut down” the telecommunications infrastructure or restricted access to journalists. It becomes a situation of not just being able to get public information out but a condition of not being able to get any information at all. As we have seen over the last few weeks, when networks or communication is shut down people revert old network connections (mesh or dial-up) in order to harness new platforms– Twitter, Facebook and other social media – to subvert these network shutdowns. It’s outstanding ingenuity – voice to Tweet for example – and innovation that is providing us with a slew of crisis data. So now we have the information but what do we do with the data? This is the second dimension of information symmetry.

This weekend I met with Gisli Olafsson, NetHope’s Emergency Response and Preparedness Director, as we were both speaking at Harvard for separate events (who knew Harvard was the hotbed of technology, connectivity and enterprise). Gisli, whose blog on disaster response is a great read for anyone interested in this space, told me about the efforts of NetHope, OCHA, and countless other organization and volunteers around the world. Spread across the globe, connected by technology and social media this group is monitoring social media, mainstream media and response organization reports for updates on the terrible situation in and around Libya. I remember this group well from my time in Haiti almost a year ago. Following the devastating earthquake in Haiti this volunteer community rose up to try to help in their own way the people affected by that terrible disaster. Thus was born a new opportunity to improve situation information management that leveraged the human capital of countless volunteers around the world to tackle the very sticky problem of information asymmetry.

Screenshot of Libya Crisis MapThe efforts of this group (OCHA, UNOSAT and NetHope have been collaborating with the Volunteer Technical Community (VTC) specifically CrisisMappers, Crisis Commons, Open Street Map, and the Google Crisis Response Team over the past week) are available now for the public here. For the general public this is a fascinating look at the revolution of connectivity, technology, social media in reporting and responding to one of today’s most pressing global crisis’. For the people of the UN and its agencies, NetHope’s 32 international NGOs and countless others who are responding to the crisis this information provides the pivot point for rapid response and an important tool in overcoming the persistent condition of information symmetry. As this movement gains stream and structure the chapter I wrote less than six months ago may become a bookmark of the past as we begin to stage our response and resources in a way that saves countless lives – but hey I’m not going to feel too bad about my outdated chapter because that is the pace of innovation coupled with the persistence of the human spirit.

Or more precisely, swarming micro air vehicles, to create a communications cloud where infrastructure is destroyed during an emergency like an earthquake.  SciDev reports on a Swiss  innovation that hovers at the extreme end of ICT4D – at least for now.  Flying robots could help in disaster rescue – SciDev.Net.

But the same team also produced the awesome SenseFly drone, which costs around 9K and fits in a briefcase.  The possibilities for monitoring and mapping for biodiversity and agriculture appear to be endless. Check out the video.

Lest you think I’m a shill for the Lausanne techies, let me take the opportunity to draw your attention to some homebrew options.  These won’t create the swarming communications cloud suitable for a major disaster, but a lot can happen.

Grassroots Mapping is a network of technology hackers that use balloon and kite mounted digital cameras in mapping, to serve as “community satellites” – a low cost remote sensing alternative to satellite imagery that can get surprisingly good results.  Significantly, the technology is affordable and can be put in the hands of communities for participatory planning, independent monitoring, and access to information – key aspects of our quest for good governance.  The Public Laboratory for Open Technology and Science is a sister initiative working to develop new technologies for grassroots mappers.

I’ve mentioned Participatory GIS – the use of GIS in community mapping – in earlier posts.  PPGIS is a virtual network online consisting of resources and a very active email list to support a peer-to-peer learning network spanning the globe.

So there you have it – we started with a drone swarm and ended up with a kite. The needs of tomorrow (and today) will be well served by one or the other.

As the wise one said, knowledge is knowing that the tomato is a fruit.  Wisdom is knowing not to put it in a fruit salad.

Copyright © 2020 Integra Government Services International LLC