How should we engage the disenfranchised? The organization “Participación Ciudadana” is addressing this issue, aiming to involve Ecuadorian society in processes of social transformation. The approach is to inform citizens of news who are often forgotten about by the centric-national media. The project, Participación Ciudadana, is an electronic newspaper produced by regional news agencies in the provinces of Azuay, Guayas, Imbabura and Manabí. The newspaper is published online, featuring topics on politics, jurisdiction, legislation, elections, citizenry, the diaspora, and Latin America.

Participación Ciudadana allows the public to participate in the newspaper, accepting written articles, videos, forum discussions, and online surveys to stir debate in a society that struggles to find space for open criticism. The newspaper is deemed successful with its wide-range of readers seeking local information. A special feature that is popular is the live-streaming debates between experts and stakeholders on government policies.

Further steps are being made to keep the newspaper sustainable, by selling advertising space and seeking support from donors.

Bus Rapid Transit (BRT) is growing in popularity worldwide as a way to provide faster, more efficient transportation that is lower in carbon emissions than traditional bus routes and less costly than light rail. BRTs are growing in popularity particularly in Latin America and Asia.

BRTdata.org was launched at the end of March by EMBARC, World Resources Institute, Across Latitudes and Cultures (ALC-BRT CoE), and International Energy Agency (IEA). The website is useful for researchers, transit agencies, city officials, and others who wish to better understand  and improve bus corridors in their cities. BRTdata.org compares BRT systems and bus corridors in 134 cities in 36 countries using metrics such as system operations, design and cost, passengers per day, commercial speed, and length of corridors. IEA wrote that, “this database will be helpful to planners, and is an essential component in calculating energy efficient scenarios which inform decision makers of practical ways of transitioning to a more secure, sustainable and affordable energy future.”

Photo Credit: TV Pro Gear

An initiative being co-led by Conservation International (CI), the Council for Scientific & Industrial Research (CSIR), South Africa and the Earth Institute (EI), Columbia University, has been launched with a grant from the Bill & Melinda Gates Foundation.

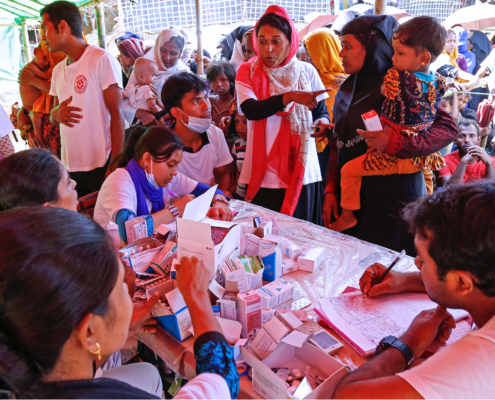
The Africa Monitoring System (AMS) tool will track, monitor and diagnose agricultural productivity, ecosystem health, and human well-being in African landscapes with near real-time data to better understand the opportunities and trade-offs of increased agricultural production. The system will provide tools to ensure that agricultural development does not degrade natural systems and the services they provide, especially for smallholder farmers.

The three-year $10 million dollar grant was announced by the co-chair of the foundation, Bill Gates in Rome at the 35th Session of the Governing Council of the International Fund for Agricultural Development (IFAD) held in February. The grant lays the foundation for a new integrated monitoring system in five regions of Sub-Saharan Africa, including Tanzania, Ghana, Ethiopia, and two other countries to be determined, where agricultural intensification is targeted to meet the needs of Africa’s growing population.

Dr. Sandy Andelman, a vice president of Conservation International who will serve as Africa Monitoring System executive director said, “We face this enormous challenge that boils down to this key question: How are we going to feed nine billion people on the planet without destroying nature, especially in the face of climate change which in itself brings vast uncertainty. The answer is that we can no longer afford to make decisions without really seeing the full picture of what is happening to the planet.”

The Africa Monitoring System (AMS)

The success of the system will depend on the accuracy and timeliness of the data collection process which will happen at multiple scales to create the most accurate possible picture. This will include

  • A household scale, using surveys on health, nutritional status, household income and assets;
  • A plot scale to assess agricultural production and determine what seeds go into the land, where they come from, what kind of fertilizer is used, what yield of crops they deliver, what happens after the harvest;
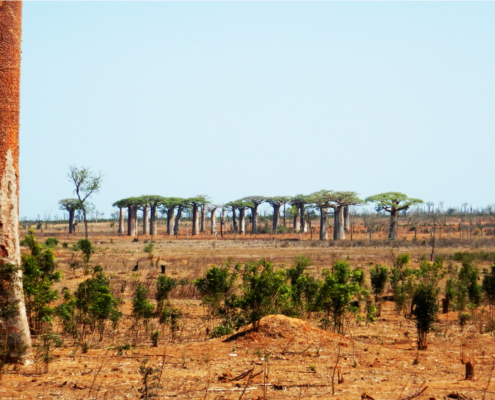
  • A landscape scale (100 km2) measuring water availability for household and agricultural use, ecosystem biodiversity, soil health, carbon stocks, etc.; and
  • A regional scale (~200,000 km2) that will tie everything together into a big picture, to see the scales at which agricultural development decisions are made.

The raw data will be fully accessible and synthesized into six simple holistic indicators that communicate diagnostic information about complex agro-ecosystems, such as:  availability of clean water, the resilience of crop production to climate variability or the resilience of ecosystem services and livelihoods to changes in the agricultural system. The near real-time and multi-scale data will be pooled into an open-access online dashboard that policy makers will be able to freely use and customize to inform smart decision making.

“Rather than having a set of data over here for one issue, and other sets of data over there for other issues, what this system will essentially do is assemble the different puzzle pieces into one clear image that will allow decision makers to transparently see the parts and their sum in one centralized location”, Andelman explained.

CI Chairman and CEO Peter Seligmann praised the grant as a landmark moment in conservation which would inspire others.  “We are honored to be entrusted by the foundation to shepherd their largest investment to date in examining the relationship between agriculture and the environment, and I could not be more encouraged or appreciative for their leadership, concluded Seligmann.”

CI, CSIR and Earth Institute will collaborate with governments, other non-governmental organizations, the academic community, the private sector and key international partners over the next three years to design and implement the Africa Monitoring System. This period will represent Phase 1 (three years) of a three-phase process (10-15 years) to create an Integrated Global Monitoring System for Agriculture, Ecosystem Services and Human Well-Being, and developers expect to mobilize additional resources to leverage the Foundation’s investment.

WaterWiki.net, a UNDP, UN-Water initiative recently relaunched and added more features such as a LinkedIn discussion forum. WaterWiki is a useful resource and popular forum for practitioners and agencies. It features over 800 articles, case studies and reports.

Some of the best features:


New Agriculturist
reports that International Small Group & Tree Planting Program (TIST) has begun to train over 50,000 farmers in eastern Kenya on carbon trading. TIST reports that it has planted over six million trees in Kenya. TIST is involved in tree planting ventures across Africa and Asia.

In this particular initiative, TIST acts as a broker between farmers with trees and individuals or companies who wish to offset their carbon footprint. TIST trains locals to track farmers’ trees using hand-held computers and GPS devices. The trained locals record the location, number, size, species, and take photos that are uploaded and posted online. Three to six months after planting, a tree is eligible for carbon credits that earn farmers 1.50 shillings (US $0.02) per tree annually.

Besides monetary benefit, the tree planting also provides farmers more secure water storage during rain and drought and aid soil health and fertility. TIST is thrilled with the results of this initiative, which are leading to more sustainable land management practices.


The Africa Soil Information Service (AfSIS) makes one wonder how people coped before it existed. Africa Soil offers an enormous abundance of peer-to-peer information and services, namely data and maps that are georeferenced. The site fills a much needed gap because knowledge about the condition of African soils because it tends to be fragmented and outdated. AfSIS aims at giving the tools needed to maintain the health of the soil resource base as science and technological developments in remote sensing are providing new opportunities for low cost and efficient applications such as digital soil mapping, infrared spectroscopy, remote sensing, statistics, and integrated soil fertility management. Through such efforts areas of risk can be predicted and monitored.The Globally Integrated Africa Soil Information Service (AfSIS) is a “large-scale, research-based project to  develop a practical, timely, and cost-effective soil health surveillance service to map soil conditions, set a baseline for monitoring changes, and provide options for improved soil and land management in Africa.”

AfSIS’s efforts of dissemination and training allow access to farm communities, public and private extension services, national agricultural research and soil survey organizations, the fertilizer sector, project and local planners, national and regional policymakers,and scientists. It is used in Kenya, Tanzania, Malawi, Mali, Nigeria, Ethiopia, Mozambique, and Ghana in partnership with several academic institutions. Through the success of the project , a global mapping effort has emerged.

Some impressive activities include:

  • producing digital soil maps and environmental covariates
  • developing, implementing and maintaining the cyber-infrastructure to operate this effort
  • developing a spatial database of soil management experiments
  • linking the soil management info to the digital maps
  • developing information dissemination mechanisms including websites, method manuals and guidelines, policy brief and a digital atlas
  • mainstreaming the soil health information system

Save the Elephants is celebrated for its conservation work in Kenya, Congo, Mali, and South Africa. The four pillars of Save the Elephants are research, protection, grassroots, and education. Each of these pillars is taken seriously in a comprehensive way, keeping in mind that the ultimate approach to conservation is through local knowledge and understanding the elephant’s perspective.

Save the Elephants has used tracking technology since the mid-1990s. The Elephant Tracking Project displays movement patterns and corridors by using ESRI software that verifies GPS data. The tracking device also allows for a Quick Response Unit that notes any disturbances that might signal poaching. An integral part of Save the Elephants’ tracking and research is based off of data collected by GPS/GSM collars that send text messages every couple of hours that contain details on their location, air temperature, and humidity. Currently there are over eighty collars in rotation.

Tracking patterns can be viewed in Google Earth on a moving 3D  backdrop of satellite photos provided by Digital Globe. On top of these tracking images of migratory patterns, stories and events are attached for interaction and educational purposes. Through such tracking, researchers are better able to understand why elephants do what they do and the complex social structures in which they live. Researchers can infer on how the relationship between human settlements and water resources affect elephant movements. By tracking these patterns, protected corridors have been established.


Photo Credit: Save the Elephants


An interesting project that Save the Elephants has taken on is geofencing. Traditional fences can be very costly and often ineffective in deterring bull elephants from raiding small-scale agriculture near human settlements. Geofences send an SMS message to an animal management team when a collared elephant passes through it. The team then can chase the elephant out of the fields and train it through negative reinforcements not to pass through the fence again. The program is being refined to teach elephants where they can’t go and to inform farmers of potential night-raids.

Another project is called SEARS (Spatial Economics and Remote Sensing of Elephant Resources). The organization created a vegetation map of Samburu to monitor migration patterns and the distribution of individual species of vegetation. Through layering the data, researchers can note the size and nutritional value of the vegetation. The goal of this project is to better understand why elephants migrate according to specific corridors and between specific regions. Save the Elephants notes how drastically migratory routes change when there are abrupt transformations in weather norms.

Save the Elephants rejoices in the explosion of communications and technology that allow the outside world to experience remote areas. The organization regularly engages with schools and provides media on their webpage.

Last month WRI (World Resources Institute) released its report on threats to coral reefs, Reefs at Risk Revisited, a three-year study that resulted in the greatest-detailed global maps to date. The maps were produced in partnership with the Google Earth Outreach Development Grant and are meant to protect critical areas through mapping. Besides the report, maps, and data set, WRI created an awareness video that provides a tour of all of the world’s major coral reefs.


Interesting facts from the video include:

  • there are 6 coral regions of the world: Caribbean, Red Sea/Persian Gulf, Indian Ocean, Southeast Asia, Australia/Great Barrier Reef, and the Pacific
  • a quarter of life forms in the ocean live in coral reefs, which are less than 1000th of the ocean’s total area
  • more than 250 million people live near coral reefs
  • coral reefs are at risk because of unmanaged coastal development, deforestation, soil erosion, nutrient and fertilizer runoff, overfishing, and rising water temperatures
  • human actions have put 60% of coral reefs at risk


Image courtesy of WRI


Photo Credit: redd-net.org

The conservation blogosphere is covered in REDD+, but what is it? REDD+ is simply an acronym for Reduce Emissions from Deforestation and Forest Degradation. It aims to foster conservation, sustainable management of forests, and enhance forest carbon stocks through local incentives by creating a financial value for carbon stored in trees. Once this carbon is assessed and quantified, developed countries pay developing countries carbon offsets for their standing forests. By doing so, green house gas emissions can be lowered in a cost-effective way. REDD+ is different from traditional methods because “unlike afforestation and reforestation activities, which generally cause small annual changes in carbon stocks over long periods of time, stemming deforestation causes large changes in carbon stocks over a short period of time.” It also has the benefits of addressing water resource management, soil erosion, flooding reduction, biodiversity, and other issues.

Where is it used? USAID provides a database of current projects. REDD is also being proposed after a recent publication in Nature Climate Change released a study that tropical rainforests store 229 billion tons of carbon in their vegetation. This study, through The Woods Hole Research Center, used new satellite-based assessment, including cloud-penetrating LiDAR (less degree of error).  The findings are available in a free downloadable carbon density map here.


Biomass Map, Photo Credit: WHRC


Photo Credit: Inhabit


Energy consumption is ever increasing. Supply systems can’t keep up with the demand and are maxed out, causing blackouts, unreliable service and headache. There is limited distribution for rural areas and alternative sources are difficult to integrate into the existing network. How are we to provide energy to a growing and more connected world?

A smart grid is a digital electrical grid. It gathers, distributes, and acts on information through meters that communicate via a wireless mesh network in order to improve efficiency and sustainability of electrical services. Often smart grids can reduce peak demand, shift usage to off-peak hours, lower total energy consumption, and actively manage other usage to respond to solar, wind, and other renewable resources. It allows consumers to optimize the generation, transmission, distribution, and use of energy in a more efficient way. Smart grids are slowly being implemented across the U.S. and Europe.

As a broad concept, a smart grid is envisioned to have the following key characteristics:

  1. Self-healing: The electricity grid rapidly detects, analyzes, responds, and restores power supply;
  2. Digital technology: Two-way communications and ubiquitous metering and measurement enable finer control of energy flows;
  3. Integration: The grid accommodates a variety of resources, including renewable energy (solar, wind, biomass and hydro), demand side management and efficient end-use,
  4. Empowering: Incorporates EE consumer equipment and behavior in grid design and operation,
  5. Power quality: The grid provides quality power consistent with 21st century consumer and industry needs,
  6. Cyber security: The grid mitigates and is resilient to physical/cyber-attacks, and
  7. Fully enables and is supported by competitive electricity markets

The development community has been slow at discussing and beginning to analyze the impact smart grids could have, perhaps because the outcomes can be varied. The UN Industrial Development Organization (UNIDO) has suggested smart grids for Sub-Saharan Africa as a solution to the lack of access and increasing population. A smart grid could leapfrog elements of a traditional power system and offer where it was impossible before. It can also offer lower rates during off-peak hours, charging for energy consumption via mobile phone. USAID has signed a partnership for smart grid technology development with Russia and India.

The most exciting example of implementation for 2012 is that of Equador. Under the state-owned electric utility, Electrica de Guayaquil, Equador has installed a meter-to-cash smart meter system that uses Itron and Trilliant’s communication platform. The communication network manages energy loses accurately, measuring use and other applications like theft analytics.

Copyright © 2020 Integra Government Services International LLC